

COHHIO’s Homeless Management Information System (HMIS) team recently created a new tool that helps visualize the severity of homelessness throughout Ohio’s 88 counties.
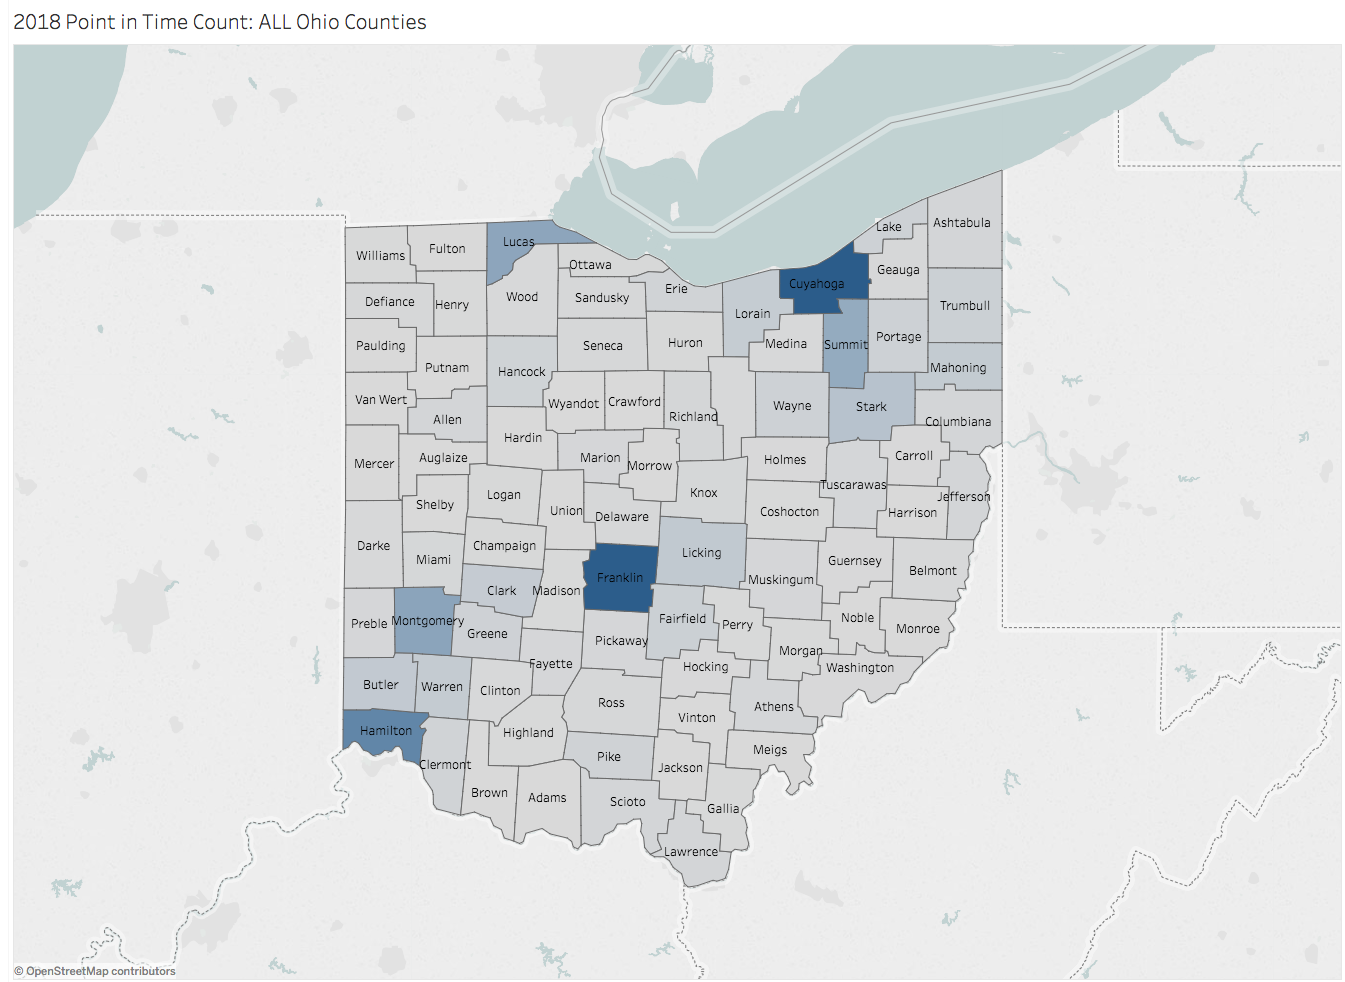
For the first time ever, aggregate data from the 2018 Point in Time (PIT) count for every county in the state has been gathered into one source, an online interactive Tableau Map. COHHIO’s HMIS team has also created a similar map for Ohio’s Balance of State Continuum of Care region covering the 80 non-urban counties.
The Ohio map can be used to find counts of households and individuals by county from the most recent PIT count. The Ohio Balance of State map, which includes only the more rural counties, includes a variety of subcategories such as race and gender demographics of homeless households.
The PIT Count is required by HUD and tallies the number of unsheltered and sheltered homeless individuals and families on one night at the end of January each year. While it’s only a small fraction of the total number of people who experience homelessness each year, the PIT Count is an important part of a variety of data that helps guide the continued fight to end homelessness in the state of Ohio.
If other Continuum of Care leads are interested in accessing the data used to develop these maps, COHHIO’s HMIS team is happy to share the information. You can reach them at the following email: hmis@cohhio.org